Nginx-graphs: Difference between revisions
| Line 2: | Line 2: | ||
[[image:top20-all.png]] | [[image:top20-all.png]] | ||
[[image:hits-vs-ip-per-page.png]] | [[image:hits-vs-ip-per-page.png]] | ||
==human traffic== | |||
<pre> | |||
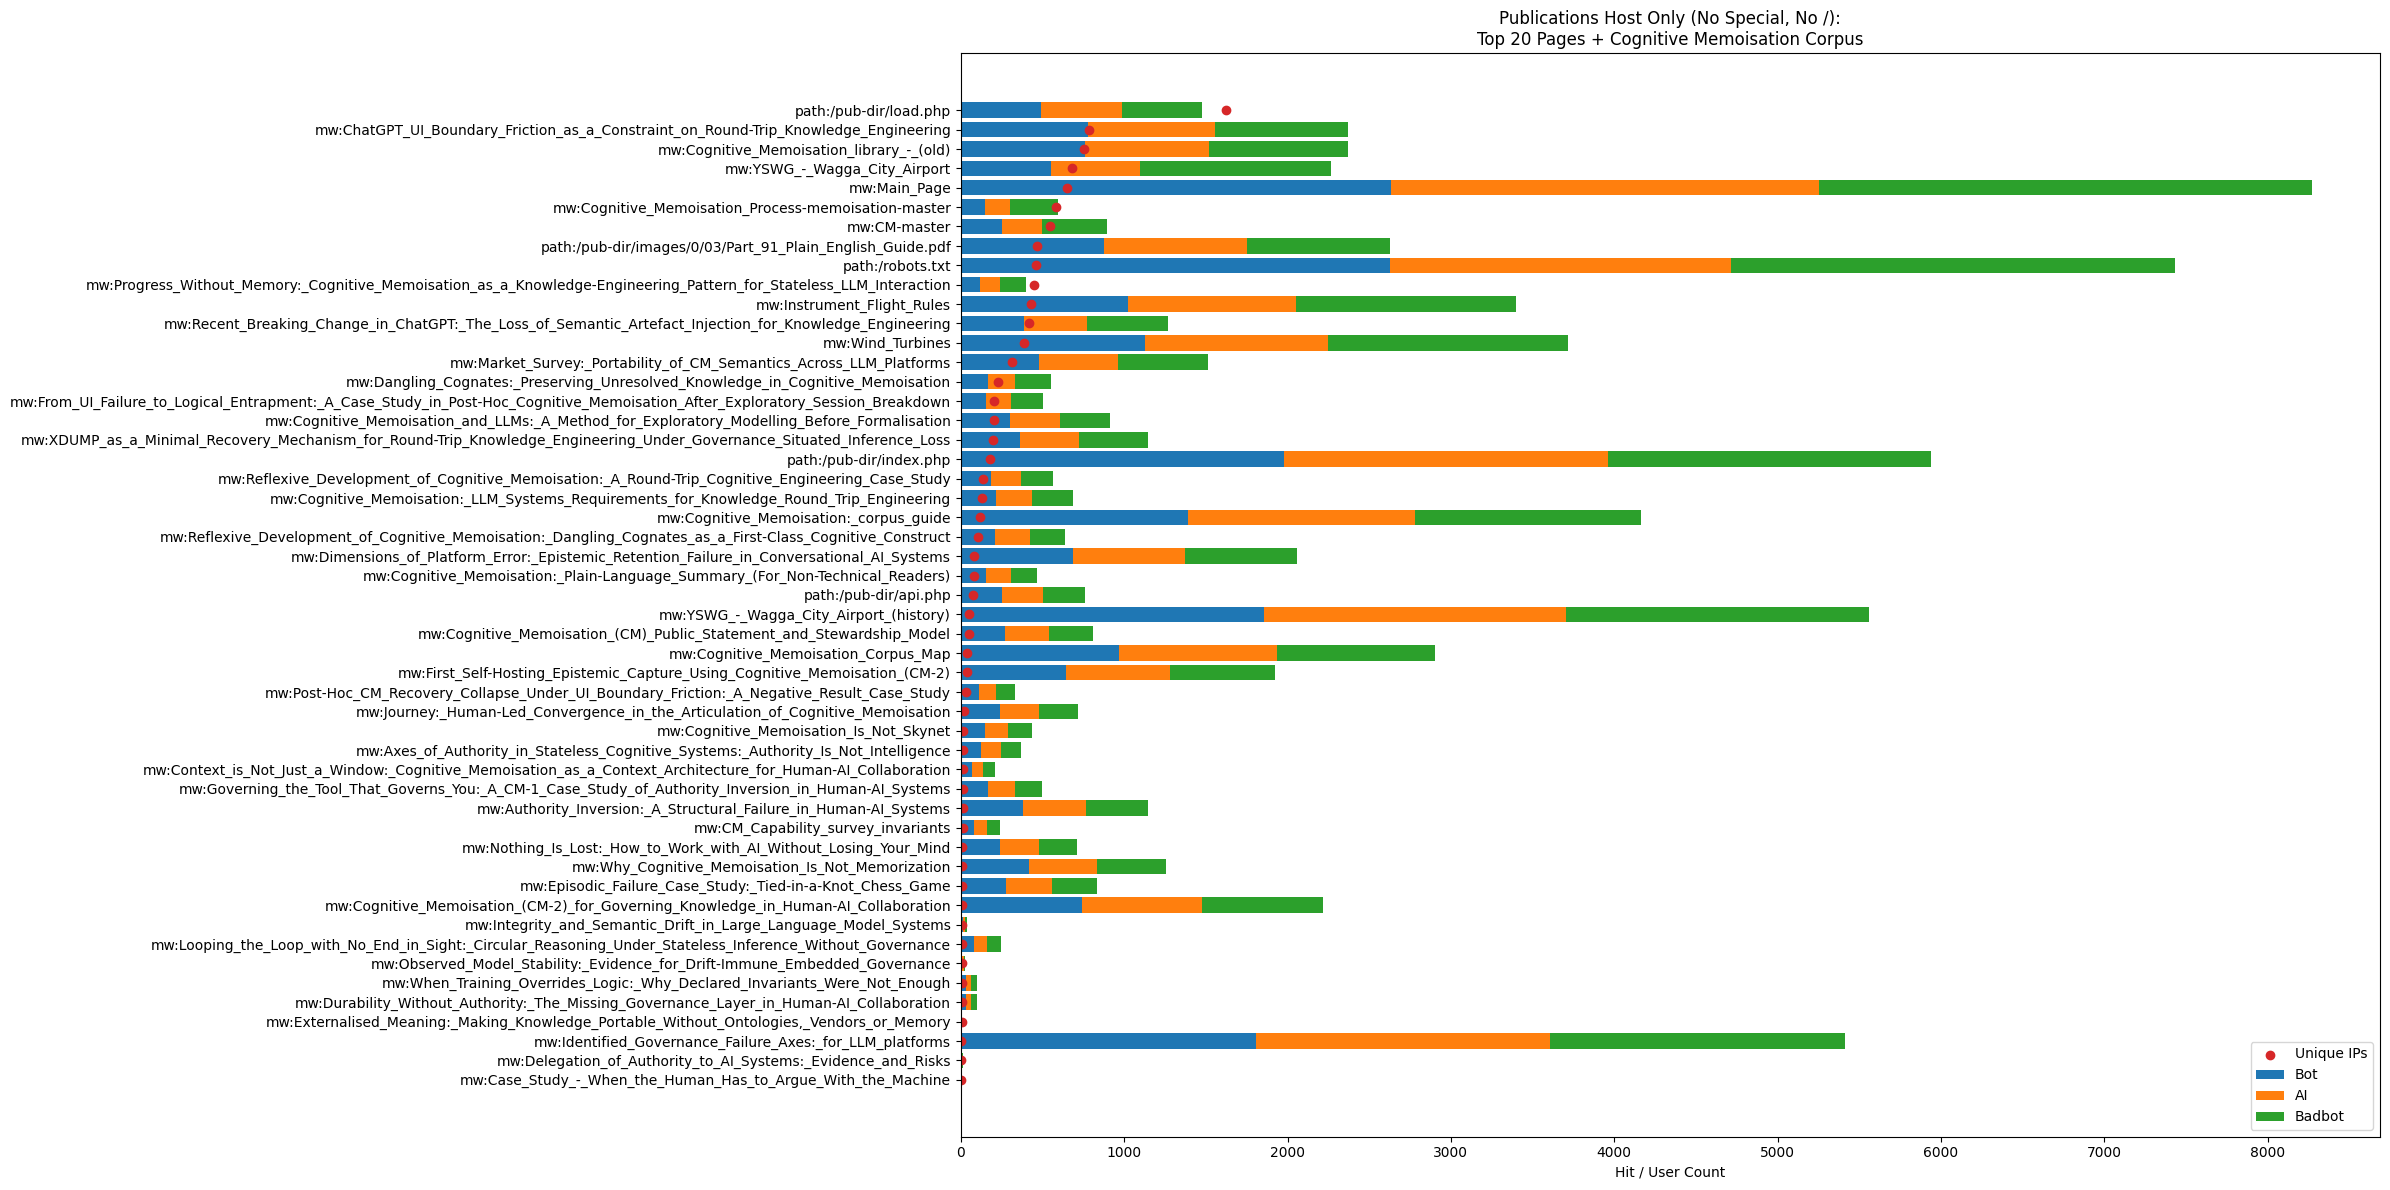
= MWDUMP Normative: Log-X Traffic Projection (Publications ∪ CM) = | |||
== Scope == | |||
This normative defines a single 2-D projection plot over the union of: | |||
* Top-N publication pages (by human hits) | |||
* All CM pages | |||
Each page SHALL appear exactly once. | |||
== Population == | |||
* Host SHALL be publications.arising.com.au unless explicitly stated otherwise. | |||
* Page set SHALL be: UNION( TopN_by_human_hits(publications), All_CM_pages ) | |||
== Ordering Authority == | |||
* Rows (Y positions) SHALL be sorted by human hit count, descending. | |||
* Human traffic SHALL define ordering authority and SHALL NOT be displaced by automation classes. | |||
== Axes == | |||
=== Y Axis (Left) === | |||
* Y axis SHALL be categorical page identifiers. | |||
* Full page names SHALL be rendered to the left of the plot region. | |||
* Y axis SHALL be inverted so highest human-hit pages are at the top. | |||
=== X Axis (Bottom + Top) === | |||
* X axis SHALL be log10. | |||
* X axis ticks SHALL be fixed decades: 10^0, 10^1, 10^2, ... up to the highest decade required by the data. | |||
* X axis SHALL be duplicated at the top with identical ticks/labels. | |||
* Vertical gridlines SHALL be rendered at each decade (10^n). Minor ticks SHOULD be suppressed. | |||
== Metrics (Plotted Series) == | |||
For each page, the following series SHALL be plotted as independent point overlays sharing the same X axis: | |||
* Human hits: hits_human = hits_total - (hits_bot + hits_ai + hits_badbot) | |||
* Bot hits: hits_bot | |||
* AI hits: hits_ai | |||
* Bad-bot hits: hits_badbot | |||
== Marker Semantics == | |||
Markers SHALL be distinct per series: | |||
* Human hits: filled circle (●) | |||
* Bot hits: cross (×) | |||
* AI hits: triangle (△) | |||
* Bad-bot hits: square (□) | |||
== Geometry (Plot Surface Scaling) == | |||
* The plot SHALL be widened by increasing canvas width and/or decreasing reserved margins. | |||
* The plot SHALL NOT be widened by extending the X-axis data range beyond the highest required decade. | |||
* Figure aspect SHOULD be >= 3:1 (width:height) for tall page lists. | |||
== Prohibitions == | |||
* The plot SHALL NOT reorder pages by bot, AI, bad-bot, or total hits. | |||
* The plot SHALL NOT add extra decades beyond the highest decade required by the data. | |||
* The plot SHALL NOT omit X-axis tick labels. | |||
* The plot SHALL NOT collapse series into totals. | |||
* The plot SHALL NOT introduce a time axis in this projection. | |||
== Title == | |||
The plot title SHOULD be: | |||
"Publications ∪ CM Pages (Ordered by Human Hits): Human vs Automation (log scale)" | |||
== Validation == | |||
A compliant plot SHALL satisfy: | |||
* Pages readable on left | |||
* Decade ticks visible on bottom and top | |||
* Scatter region occupies the majority of horizontal area to the right of labels | |||
* X-axis decade range matches data-bound decades (no artificial expansion) | |||
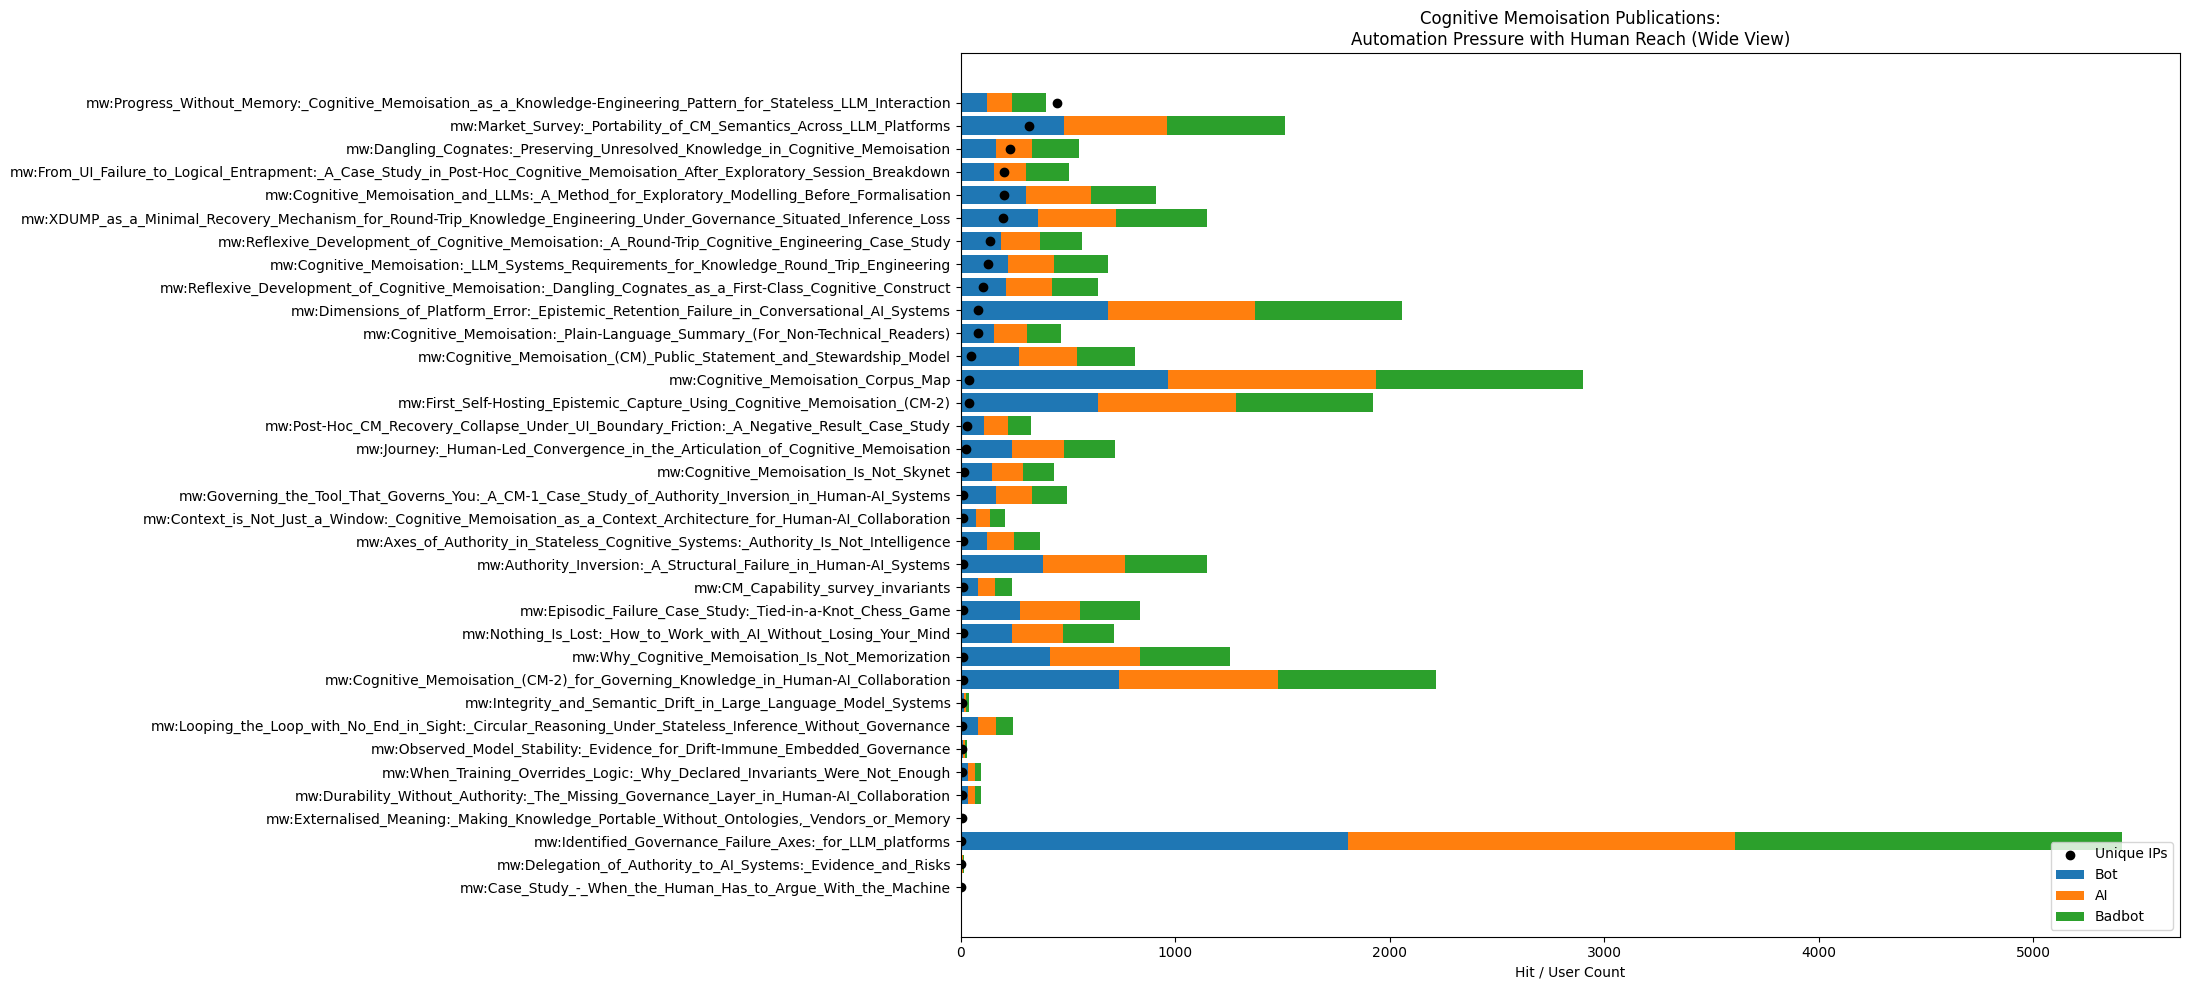
[[image:automation-per-page.png]] | [[image:automation-per-page.png]] | ||
Revision as of 11:42, 22 January 2026
all virtual servers


human traffic
MWDUMP Normative: Log-X Traffic Projection (Publications ∪ CM)
Scope
This normative defines a single 2-D projection plot over the union of: * Top-N publication pages (by human hits) * All CM pages Each page SHALL appear exactly once.Population
* Host SHALL be publications.arising.com.au unless explicitly stated otherwise. * Page set SHALL be: UNION( TopN_by_human_hits(publications), All_CM_pages )Ordering Authority
* Rows (Y positions) SHALL be sorted by human hit count, descending. * Human traffic SHALL define ordering authority and SHALL NOT be displaced by automation classes.Axes
Y Axis (Left)
* Y axis SHALL be categorical page identifiers. * Full page names SHALL be rendered to the left of the plot region. * Y axis SHALL be inverted so highest human-hit pages are at the top.X Axis (Bottom + Top)
* X axis SHALL be log10. * X axis ticks SHALL be fixed decades: 10^0, 10^1, 10^2, ... up to the highest decade required by the data. * X axis SHALL be duplicated at the top with identical ticks/labels. * Vertical gridlines SHALL be rendered at each decade (10^n). Minor ticks SHOULD be suppressed.Metrics (Plotted Series)
For each page, the following series SHALL be plotted as independent point overlays sharing the same X axis: * Human hits: hits_human = hits_total - (hits_bot + hits_ai + hits_badbot) * Bot hits: hits_bot * AI hits: hits_ai * Bad-bot hits: hits_badbotMarker Semantics
Markers SHALL be distinct per series: * Human hits: filled circle (●) * Bot hits: cross (×) * AI hits: triangle (△) * Bad-bot hits: square (□)Geometry (Plot Surface Scaling)
* The plot SHALL be widened by increasing canvas width and/or decreasing reserved margins. * The plot SHALL NOT be widened by extending the X-axis data range beyond the highest required decade. * Figure aspect SHOULD be >= 3:1 (width:height) for tall page lists.Prohibitions
* The plot SHALL NOT reorder pages by bot, AI, bad-bot, or total hits. * The plot SHALL NOT add extra decades beyond the highest decade required by the data. * The plot SHALL NOT omit X-axis tick labels. * The plot SHALL NOT collapse series into totals. * The plot SHALL NOT introduce a time axis in this projection.Title
The plot title SHOULD be: "Publications ∪ CM Pages (Ordered by Human Hits): Human vs Automation (log scale)"Validation
A compliant plot SHALL satisfy: * Pages readable on left * Decade ticks visible on bottom and top * Scatter region occupies the majority of horizontal area to the right of labels * X-axis decade range matches data-bound decades (no artificial expansion)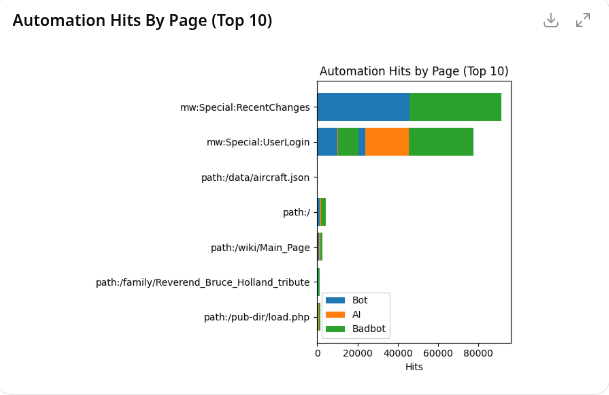
publications


categories
categories


